How to Read Your Electric Bill Before Buying Plug-in Solar
Every honest estimate of what plug-in solar will save starts with one document: your electric bill. It tells you how much electricity you use, what you really pay per kilowatt-hour once every charge is counted, which part of the bill solar can shrink and which part it cannot, and whether you are on a rate plan that changes the math. Most people glance at the total and the due date. Ten minutes with the details can stop you from buying a kit that is too big, or from expecting savings your plan will never deliver. This guide walks through a typical US electric bill line by line, shows how to work out your true price per kWh, and explains what each number means for plug-in solar. It uses EIA data for context. We have not tested any kit.
Find four things on your bill: your monthly kWh use, your rate plan (flat, tiered or time-of-use), the charges that change with kWh, and the fixed charges that do not. Divide the usage-based charges by your kWh to get the price a plug-in kit actually saves you per kWh. Fixed customer charges stay the same no matter how much solar you make.
- Know your usage. EIA reports the average US residential customer used 865 kWh a month in 2024; yours may be very different.
- Know your real price. EIA’s average US residential price was 17.30 cents per kWh in 2025, but prices and bills vary widely by state.
- Solar only cuts usage-based charges. Fixed monthly fees do not change.
- Your rate plan matters. Tiered and time-of-use plans change what each solar kWh is worth.
- Look at 12 months, not one bill, because use changes a lot with the seasons.
Why the bill comes first
A plug-in kit saves money by reducing the kilowatt-hours you buy. So two numbers decide your savings: how many kWh the kit offsets, and what each of those kWh would have cost you. The first depends on the kit and your sun, which our daily output guide covers. The second is on your bill, and it is often higher or lower than the headline “rate” printed there.
Context helps. EIA reports that monthly electricity use per residential customer averaged 865 kWh in 2024, and that average bills vary widely: in its 2025 analysis, bills in Hawaii and Connecticut were more than twice those in New Mexico and Utah, driven by both prices and how much electricity customers use. EIA’s average US residential price was 17.30 cents per kWh in 2025. Your own bill is the only number that counts for your decision.

Stock photo (Freepik) for illustration only. It is not a Borizo installation, and we have not tested any product shown.
A typical bill, line by line
| Line on the bill | What it is | Does plug-in solar reduce it? |
|---|---|---|
| Usage (kWh) | Electricity you bought from the grid this period | Yes, this is what the kit lowers |
| Energy or supply charge | Price per kWh for the electricity itself | Yes, scales with kWh |
| Delivery, distribution or transmission charge | Price per kWh for moving electricity to you | Usually yes, if charged per kWh |
| Riders, surcharges, fuel adjustments | Extra per-kWh charges for programs or fuel costs | Usually yes, if charged per kWh |
| Customer, service or basic charge | Fixed monthly fee for being connected | No |
| Demand charge (some plans) | Charge based on your highest power use in a period | Rarely; depends on timing |
| Taxes | Often a percentage of the bill | Partly, if based on usage charges |
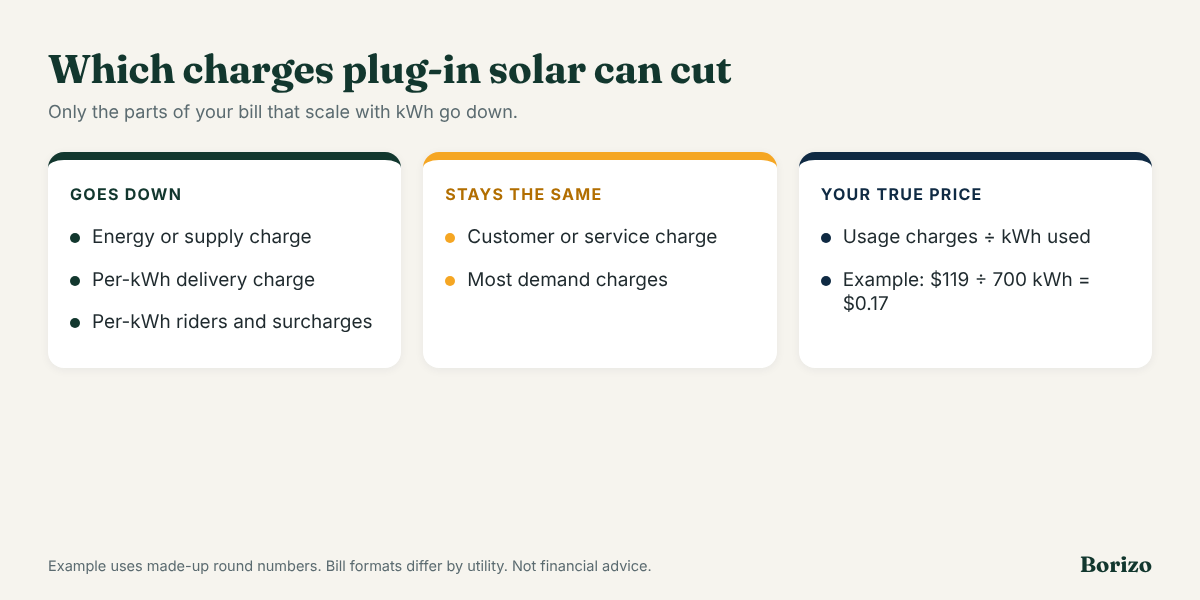
If your utility splits supply and delivery, as many do, both usually scale with kWh, so both shrink when your kit is producing. The fixed customer charge does not. On a low-use bill, that fixed charge can be a large share of the total, which limits how far any kit can cut it.
Work out your true price per kWh
This is the number to use in any savings estimate, including our payback guide:
- Add up every charge that scales with kWh: energy or supply, delivery, and per-kWh riders and surcharges.
- Divide by the kWh used that month. The result is your effective price per kWh.
- Repeat for a summer and a winter bill, since some utilities charge different seasonal rates.
- Ignore fixed charges in this number, because solar does not change them.
Example, with made-up round numbers: a bill shows 700 kWh, a $15 customer charge, and $119 in energy, delivery and per-kWh riders combined. The effective price is $119 ÷ 700 = $0.17 per kWh. Each kWh your kit offsets saves about 17 cents; the $15 stays.
Check your rate plan
- Flat rate: every kWh costs the same. Easiest to estimate.
- Tiered rate: the price rises after you use a set amount in a month. A kit reduces your highest-priced kWh first, which can make it worth a little more than the average price.
- Time-of-use rate: the price depends on the hour. A kit mostly offsets cheaper midday power. Our time-of-use guide explains how to estimate it.
- Net metering or export credits: if your bill shows “received” or “exported” kWh, ask how they are credited.
The plan name is usually printed near the usage section. Look it up on your utility’s website for the full price schedule.
Look at a full year
Use changes with the seasons: air conditioning in summer, heating and lighting in winter. Many bills include a 12-month usage chart. Note:
- Your lowest and highest months, and the yearly total.
- Whether your highest use falls in sunny months (good for solar) or dark months (less helpful).
- Any months with very low use, when a kit is most likely to export.
A plug-in kit’s output is highest in late spring and summer and lowest in winter, as our winter guide explains. Compare that pattern with your own year.
What the bill tells you about kit size
Your monthly total does not tell you how much power you use at midday, which is what decides whether your home can use a kit’s output as it is made. If your utility offers hourly data online, look at that too. Hourly or 15-minute readings show what your home draws on a sunny weekday afternoon, when a kit produces most. As a rough check, a kit producing about 80 kWh a month, like the 800 W kit in our savings example, is about 9% of the EIA average of 865 kWh. If your bill shows 300 kWh a month, the same kit is a much larger share, and more of its output may flow out to the grid. Our how many panels guide helps match a kit to your use.
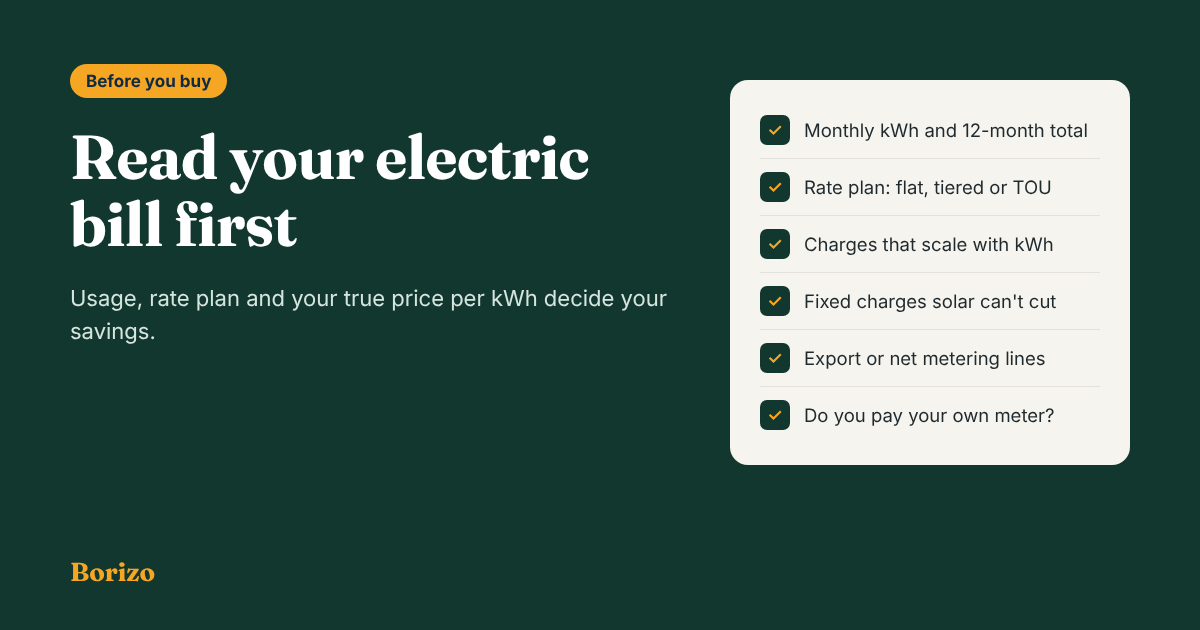
A quick bill checklist
- Monthly kWh, and the 12-month total.
- Rate plan name and type: flat, tiered or time-of-use.
- Effective price per kWh from usage-based charges.
- Fixed monthly charges that solar will not change.
- Any export, “received” or net metering lines.
- Whether you pay your own metered bill, or electricity is included in rent or split by the landlord.
That last point matters for renters: if you do not pay your own metered bill, a kit may not lower what you pay. See renters and HOAs.
Frequently asked questions
What should I look for on my electric bill before buying solar?
Your monthly kWh use, your rate plan, the charges that scale with kWh and the fixed charges that do not. Divide the usage-based charges by your kWh to get the price each solar kWh will save you.
Will plug-in solar lower my fixed monthly charge?
No. Fixed customer or service charges stay the same no matter how much solar you produce. A kit lowers only the charges that scale with the kilowatt-hours you buy.
How much electricity does an average US home use?
EIA reports that monthly use per residential customer averaged 865 kWh in 2024. Your own use may be much higher or lower, so check your bill’s 12-month history.
What is a good price per kWh to use in a solar savings estimate?
Your own effective price: add up all charges that scale with kWh and divide by the kWh used. EIA’s average US residential price was 17.30 cents per kWh in 2025, but prices vary widely by state and utility.
Sources
- US Energy Information Administration, Today in Energy, May 12, 2025 (865 kWh a month per residential customer in 2024; bills vary by state; Hawaii and Connecticut more than twice New Mexico and Utah).
- US Energy Information Administration, Electricity explained: prices and factors affecting prices (average residential price 17.30 cents per kWh in 2025; generation is the largest cost component), read October 26, 2026.
- US Energy Information Administration, State electricity profiles and Electric Power Monthly table 5.6.A (residential prices by state).
- Photos: stock images from Freepik, used for illustration only.

Borizo is an independent guide to plug-in and balcony solar in the US. We track state laws, check certification claims against official sources, and compare kits using published specifications. Laws change often, so every state page shows a “last updated” date and links to its sources. We earn a commission when you buy through our Amazon links, at no extra cost to you. Our content is for information only and is not legal or electrical advice.