How Electricity Rates Affect Plug-in Solar Savings
Your electricity rate decides how much each solar kilowatt-hour is worth, so it often matters as much as how sunny you are. In our example, the same 1,200 W plug-in kit is worth about $190 a year in Seattle and about $600 in Los Angeles, mostly because California’s average residential rate is about twice Washington’s. The figures use EIA’s August 2026 state averages and our PVWatts runs, and they are estimates, not hands-on tests or financial advice.
Yearly savings ≈ kWh you use from the kit × the price you avoid per kWh. A higher rate makes every self-used kWh worth more and shortens payback. But the number that counts is your avoidable per-kWh charge, not your total bill divided by usage, and exported power may be credited at less.
- State rates vary more than sunshine. In August 2026, EIA averages ranged from about 12.7 cents per kWh in Nevada to about 47 cents in Hawaii.
- Sun and rate multiply. In our ten-city example, Boston and New York beat Phoenix in dollars despite less sun.
- Fixed charges do not shrink. Only per-kWh charges that fall when you buy less count as savings.
- Rates change. The US average rose from 17.57 to 18.16 cents per kWh between August 2025 and August 2026.
How rates turn solar into dollars
A plug-in kit feeds your home circuit, and whatever is running uses that power first. Each kilowatt-hour your home uses from the kit is one you do not buy from the utility, so it is worth about your per-kWh price. Power the kit makes when nothing is using it flows out to the grid, where it may earn a lower credit or nothing; see what happens to extra power.
That gives a simple formula: self-used kWh × avoidable rate = yearly savings. Our savings and payback guide covers the payback side in detail. This guide focuses on the rate half of the formula: what it is, where to find it and how much it varies.
Savings at different rates
Here we hold output fixed at about 1,440 kWh a year, what a 1,200 W kit makes at 4 peak sun hours with PVWatts default losses, and change only the rate. The payback column uses a round $1,200 total cost as an example, not a product price.
| Avoidable rate | Yearly savings (all 1,440 kWh used at home) | Simple payback, $1,200 total cost |
|---|---|---|
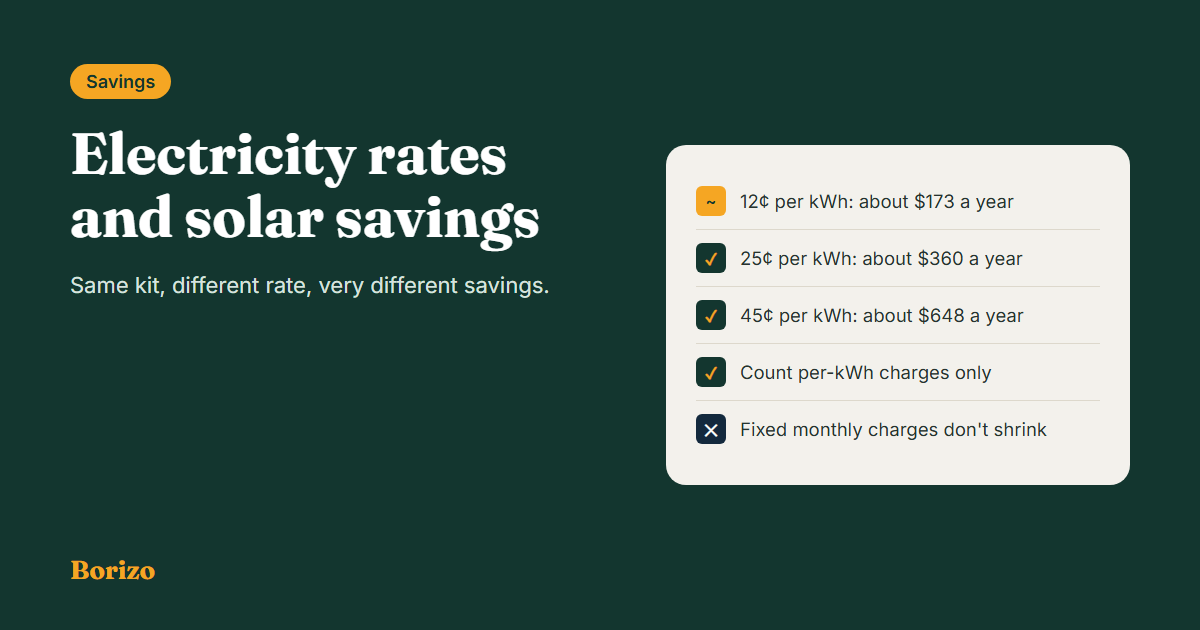
| 12¢ per kWh | About $173 | About 6.9 years |
| 17¢ per kWh | About $245 | About 4.9 years |
| 25¢ per kWh | About $360 | About 3.3 years |
| 35¢ per kWh | About $504 | About 2.4 years |
| 45¢ per kWh | About $648 | About 1.9 years |
Going from 12 to 25 cents roughly doubles the savings. Getting the same gain from sunshine would take moving from a cloudy spot to a much sunnier one.
Sun and rates together: ten US cities
This table multiplies each city’s PVWatts yearly output for a 1,200 W kit by its state’s average residential rate for August 2026 from EIA’s Electric Power Monthly, Table 5.6.A.
| City | 1,200 W kit, kWh per year (PVWatts) | State average residential rate, Aug 2026 | Value if all used at home |
|---|---|---|---|
| Los Angeles, CA | About 2,020 | 29.75¢ | About $600 |
| Boston, MA | About 1,570 | 30.48¢ | About $479 |
| New York, NY | About 1,550 | 28.65¢ | About $444 |
| Denver, CO | About 1,920 | 17.17¢ | About $330 |
| Phoenix, AZ | About 2,120 | 15.05¢ | About $319 |
| Chicago, IL | About 1,570 | 19.32¢ | About $303 |
| Dallas, TX | About 1,810 | 15.91¢ | About $288 |
| Miami, FL | About 1,860 | 14.99¢ | About $279 |
| Atlanta, GA | About 1,710 | 15.90¢ | About $272 |
| Seattle, WA | About 1,310 | 14.63¢ | About $192 |
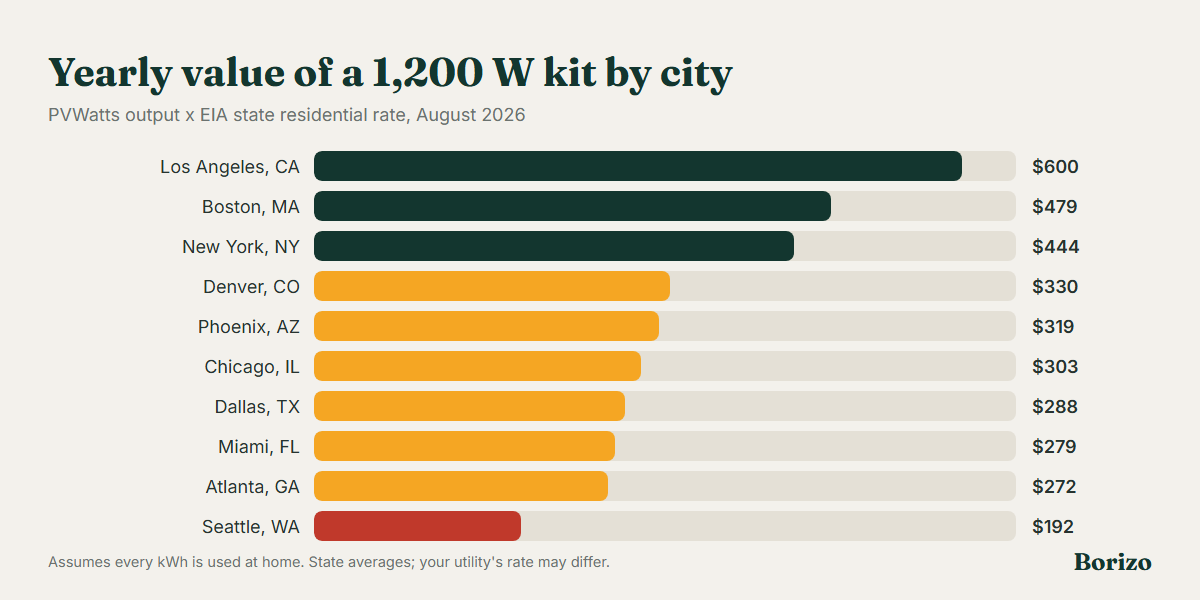
Phoenix has the most sun of the ten, yet ranks in the middle because Arizona’s average rate is lower. Boston and New York get about a quarter less sun than Phoenix but higher rates make their kWh worth more. A state average is only a guide, though. Utilities within one state can charge very different prices, so use your own bill.
Finding your real avoidable rate
EIA’s average price is total residential revenue divided by kWh sold, so it spreads fixed monthly charges across every kWh. The price you actually avoid with solar can be lower. On your bill, look for:
- Per-kWh energy or supply charges. These fall when you buy less. Count them.
- Per-kWh delivery or distribution charges. Usually also per kWh. Count them.
- Fixed customer or service charges. The same every month regardless of use. Do not count them.
- Taxes and riders. Some scale with kWh and some do not.
Add the per-kWh lines to get your avoidable rate. Our guide to reading your electric bill walks through a sample bill.
Time-of-use and tiered rates
On a time-of-use plan, the price depends on the hour. A plug-in kit produces most around midday, which may be a cheaper period than the evening peak, so use the midday price, not your average. See plug-in solar and time-of-use rates.
On a tiered plan, the price per kWh rises after a set amount of use each month. If solar keeps you out of a higher tier, each kWh saves the higher price; if you never reach that tier, it saves the lower one.
Rates move over time
EIA’s figures show the US average residential price at 18.16 cents per kWh in August 2026, up from 17.57 cents a year earlier. Some states moved much more; Hawaii’s average rose from 38.53 to 47.18 cents, while Connecticut’s fell from 30.17 to 24.51 cents. Rising rates make a kit’s future kWh worth more; falling rates do the opposite. When you estimate payback, try a lower rate as well as today’s.
How to estimate your own savings
- Get yearly output. Run PVWatts for your address and kit size.
- Estimate self-use. If someone is home in the day, or a fridge, router and other loads run, most output can be used at home. If the home is empty all day, less of it will be.
- Find your avoidable rate. Add up the per-kWh lines on your bill.
- Multiply. Self-used kWh × avoidable rate, plus any export credit your utility pays.
- Check payback. Total cost ÷ yearly savings, or use our savings and payback calculator.
Common mistakes
- Dividing the whole bill by kWh. That includes fixed charges solar cannot cut.
- Using the state average instead of your bill. Your utility’s price can be very different.
- Assuming every kWh is used at home. Exports may earn little or nothing.
- Ignoring time-of-use. Midday power may be worth less than your average price.
- Assuming rates only go up. Some state averages fell over the past year.
- Buying before checking the rules. A high rate does not make a kit legal where you live.
Check your state before you buy
In the US, plug-in solar is generally limited to about 1,200 watts and is clearly allowed only in some states. Check our state laws hub or the state rule checker, then your utility and, if you rent, your landlord. Choose a certified kit with anti-islanding protection.
Frequently asked questions
Does a higher electricity rate mean bigger plug-in solar savings?
Yes, for the kWh you use at home. At about 1,440 kWh a year, savings rise from about $173 at 12 cents per kWh to about $648 at 45 cents, if all of it is used at home.
Where do I find my state’s average electricity rate?
EIA publishes it monthly in Electric Power Monthly, Table 5.6.A. For August 2026, the US residential average was 18.16 cents per kWh. Your own bill is a better guide than the state average.
Which part of my bill does plug-in solar reduce?
The charges billed per kWh, such as energy, supply and usually delivery. Fixed monthly customer charges stay the same.
Is plug-in solar worth it in a low-rate state?
It pays back more slowly. In our example, a 1,200 W kit in Seattle was worth about $192 a year at Washington’s August 2026 average rate. A lower total cost and high self-use help most there.
How do time-of-use rates change the math?
Use the price for the hours when your kit produces, mostly late morning to mid-afternoon. If that period is cheaper than your average, your savings per kWh are lower than the average price suggests.
Sources
- US Energy Information Administration, Electric Power Monthly, Table 5.6.A, Average Price of Electricity to Ultimate Customers by End-Use Sector, by State (August 2026 and August 2025 residential prices), release of October 23, 2026, read October 27, 2026.
- PVWatts Calculator, pvwatts.nlr.gov (runs for ten cities, October 27, 2026, default inputs).

Borizo is an independent guide to plug-in and balcony solar in the US. We track state laws, check certification claims against official sources, and compare kits using published specifications. Laws change often, so every state page shows a “last updated” date and links to its sources. We earn a commission when you buy through our Amazon links, at no extra cost to you. Our content is for information only and is not legal or electrical advice.