Plug-in Solar Sun Hours by Region: PVWatts Numbers for 10 US Cities
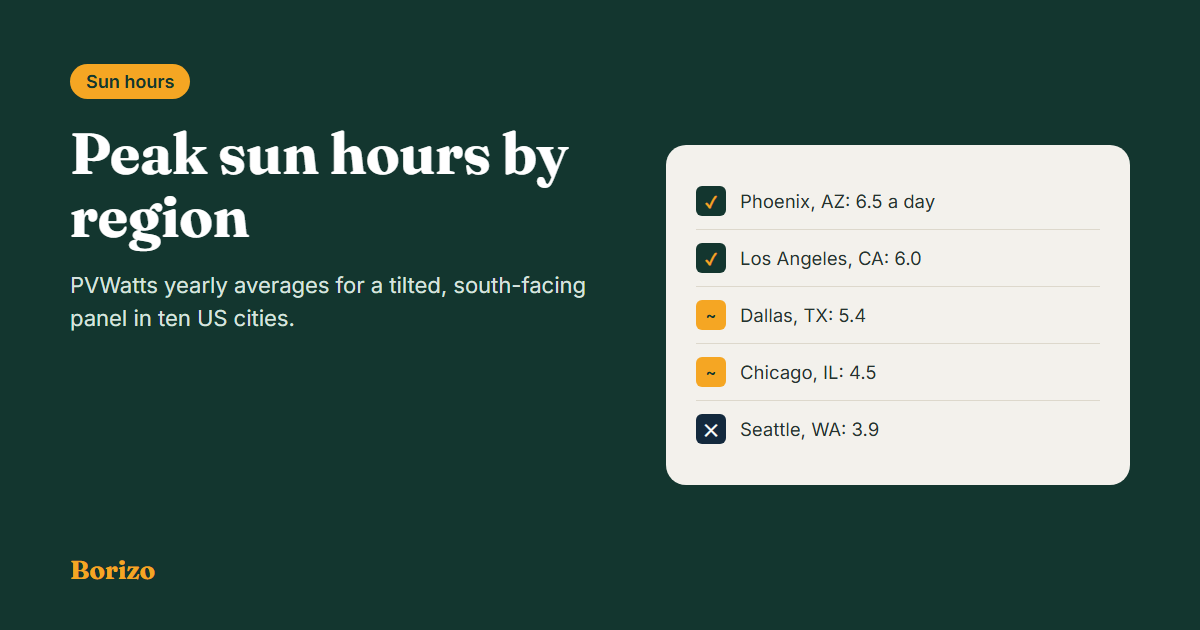
Peak sun hours in the US range from about 3.9 a day in Seattle to about 6.5 in Phoenix, based on PVWatts runs we did for ten cities on October 27, 2026. That gap means the same 1,200 W plug-in kit makes roughly 1,300 kWh a year in Seattle and about 2,100 kWh in Phoenix. The numbers below are modeled estimates for a well-aimed, unshaded panel, not hands-on tests, so treat them as a starting point and run your own address.
The sunny Southwest and Southern California get 6 to 6.5 peak sun hours a day on a tilted, south-facing panel. Texas, Florida, Colorado and Georgia sit around 5 to 5.6. The Midwest and Northeast are around 4.5, and the Pacific Northwest around 4. Winter can drop far below the yearly average, especially in the north.
- A peak sun hour is not a daylight hour. It is one hour of full-strength sunlight, 1,000 watts per square meter.
- Location shifts output by about 60%. In our runs, Phoenix beat Seattle by about 1.6 times over a year.
- Seasons matter more in the north. Seattle’s December has less than a quarter of its June sun.
- Your spot matters as much as your region. Shade, a vertical railing mount or an east or west view can cut these numbers a lot.
What a peak sun hour means
Sunlight is weak in the morning, strong at midday and weak again in the evening. A peak sun hour adds all of that up and expresses it as hours at full strength. A June day in Seattle can have more than 15 hours of daylight, yet PVWatts shows it averaging under 6 peak sun hours on a tilted panel.
PVWatts reports this as solar radiation in kWh per square meter per day, which is the same number as peak sun hours. That is the figure in our table. It is measured on the panel’s surface, so it already reflects the tilt and direction we chose.
Peak sun hours by US region
We ran the PVWatts Calculator for one city per region with the tool’s default settings: standard panels on an open rack, tilted 20 degrees, facing due south, with 14% system losses and a 96%-efficient inverter. We scaled the results to an 800 W and a 1,200 W kit. PVWatts’ default system pairs the panels with an inverter about one-sixth smaller than the panel rating (a DC-to-AC ratio of 1.2), which matches how many plug-in kits are built.
| Region (city modeled) | Peak sun hours per day, yearly average | 800 W kit: kWh per year | 1,200 W kit: kWh per year | 1,200 W kit: kWh per average day |
|---|---|---|---|---|
| Desert Southwest (Phoenix, AZ) | 6.5 | About 1,410 | About 2,120 | About 5.8 |
| Southern California (Los Angeles, CA) | 6.0 | About 1,350 | About 2,020 | About 5.5 |
| Mountain West (Denver, CO) | 5.6 | About 1,280 | About 1,920 | About 5.3 |
| Florida (Miami, FL) | 5.6 | About 1,240 | About 1,860 | About 5.1 |
| South Central (Dallas, TX) | 5.4 | About 1,210 | About 1,810 | About 5.0 |
| Southeast (Atlanta, GA) | 5.1 | About 1,140 | About 1,710 | About 4.7 |
| New England (Boston, MA) | 4.7 | About 1,050 | About 1,570 | About 4.3 |
| Midwest (Chicago, IL) | 4.5 | About 1,050 | About 1,570 | About 4.3 |
| Mid-Atlantic (New York, NY) | 4.5 | About 1,030 | About 1,550 | About 4.2 |
| Pacific Northwest (Seattle, WA) | 3.9 | About 880 | About 1,310 | About 3.6 |
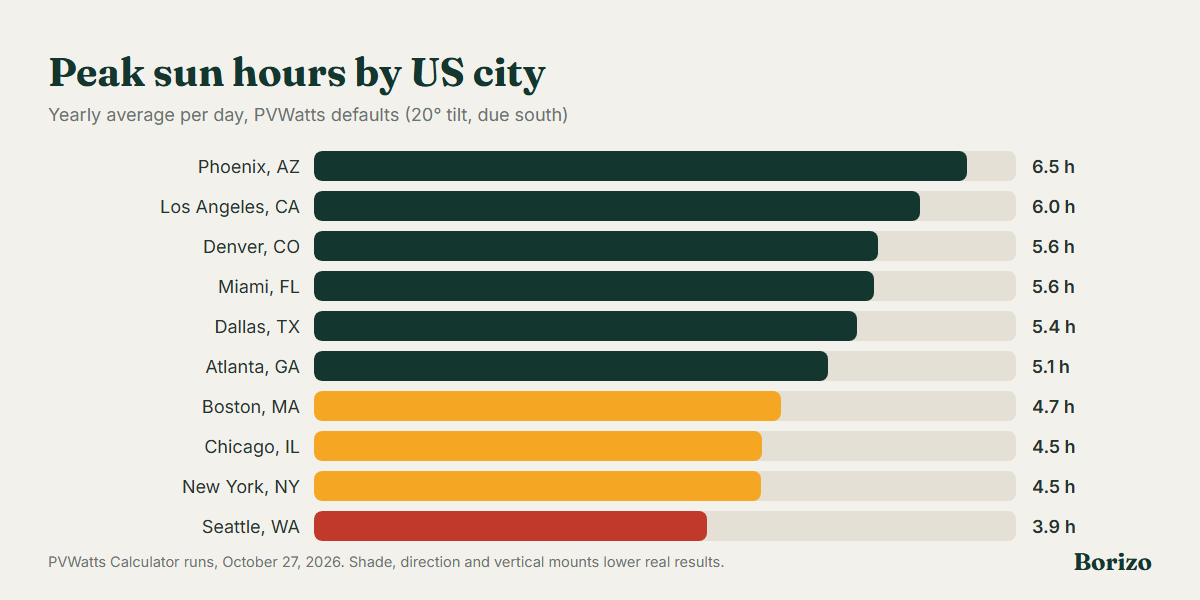
A city is not a whole region. Coastal fog, mountains, elevation and local haze all move the number, and two towns an hour apart can differ. Use the table to set expectations, then run your own address.
Why the daily kWh look lower than a simple formula
Our daily output guide uses a shortcut: watts × peak sun hours × 0.82 ÷ 1,000. For Phoenix that gives about 6.4 kWh a day from 1,200 W, but the full PVWatts simulation gives about 5.8. The difference comes from effects the shortcut leaves out, such as hot panels producing less (see plug-in solar in hot weather) and the smaller inverter capping output at midday. In cooler, cloudier cities the two methods land much closer. When you can, use PVWatts for your address rather than the shortcut.
Winter vs summer: the seasonal swing
The yearly average hides big monthly changes, and the swing grows the farther north you live. These are PVWatts monthly results for a 1,200 W kit with the same settings as the table:
| City | December peak sun hours | June peak sun hours | 1,200 W kit, December kWh | 1,200 W kit, June kWh |
|---|---|---|---|---|
| Phoenix, AZ | 4.7 | 8.1 | About 140 | About 210 |
| Miami, FL | 4.5 | 5.6 | About 130 | About 150 |
| Chicago, IL | 2.2 | 6.3 | About 70 | About 170 |
| Seattle, WA | 1.3 | 5.9 | About 40 | About 160 |
Miami’s sun is steady all year. Seattle makes about four times as much in June as in December. If you live in the north, judge a kit over a full year, not by a gray winter week. Our winter and cloudy days guide covers what to expect.
Your spot can matter more than your region
PVWatts assumed a panel tilted 20 degrees, facing due south, with no shade. Many balcony setups are different:
- Vertical railing mounts catch less sun in summer, when the sun is high, though they can do relatively well in winter. See best angle for a balcony panel.
- East or west views make power in only half the day. Our east vs west vs south guide compares them.
- Shade from a railing, tree or the balcony above can cut output more than moving from Chicago to Atlanta would add. See how shade affects balcony solar.
A Phoenix balcony that faces north and sits in shade can easily lose to a sunny, south-facing Chicago balcony.
How to find your own sun hours
- Open the PVWatts Calculator and enter your address.
- On System Info, set the DC system size to your kit, such as 0.8 for 800 W or 1.2 for 1,200 W.
- Set the tilt and azimuth to match your mount. A vertical railing panel is a 90-degree tilt; south is 180, east is 90 and west is 270.
- If part of the day is shaded, raise the losses figure to allow for it.
- Read the monthly table on the Results page. The “Solar Radiation” column is your peak sun hours.
Then feed that number into our kit size calculator or the savings and payback calculator.
Common mistakes
- Using daylight hours. Fourteen hours of daylight is not fourteen peak sun hours.
- Judging by one season. A summer week overstates the year; a winter week understates it, especially in the north.
- Using a regional average for a shaded spot. Shade and direction can outweigh climate.
- Forgetting the mount angle. Our table assumes a 20-degree tilt. A vertical panel gives different results.
- Mixing loss assumptions. Compare kits with the same method, ideally PVWatts for your address.
- Skipping the rules. Sun is only one question. State law, your utility and your lease come first.
Check your state before you buy
Plug-in solar in the US is generally limited to about 1,200 watts and is clearly allowed only in some states, with rules still changing. Check our state laws hub or the state rule checker, then confirm with your utility and, if you rent, your landlord. Choose a certified kit with anti-islanding protection.
Frequently asked questions
How many peak sun hours does my region get?
In our PVWatts runs, yearly averages on a south-facing, 20-degree panel ranged from about 3.9 a day in Seattle to about 6.5 in Phoenix, with most other large cities between 4.5 and 5.6. Run PVWatts for your own address for a better figure.
How much does a 1,200 W plug-in kit make per year in my area?
With PVWatts default settings, about 1,310 kWh in Seattle, about 1,570 kWh in Chicago or Boston, about 1,810 kWh in Dallas and about 2,120 kWh in Phoenix. Shade, direction and a vertical mount can lower these.
Is plug-in solar worth it in a cloudy region?
It can be, but it pays back more slowly. Seattle’s yearly output in our runs was about 60% of Phoenix’s. Higher electricity rates in some cloudy states can make up part of that gap, so check your price per kWh too.
Why are winter numbers so much lower?
Days are shorter and the sun is lower, so each square meter of panel gets less energy. In our runs, Seattle’s December averaged about 1.3 peak sun hours against about 5.9 in June.
Is plug-in solar legal in every state?
No. Plug-in solar is generally limited to about 1,200 watts in the US and is only clearly allowed in some states. Check our state laws hub and your utility before you buy.
Sources
- PVWatts Calculator, pvwatts.nlr.gov, National Laboratory of the Rockies (formerly NREL). Runs for Phoenix, Los Angeles, Denver, Miami, Dallas, Atlanta, Boston, Chicago, New York and Seattle made October 27, 2026 with default inputs; weather data from the National Solar Radiation Database.
- PVWatts Version 5 Manual, pvwatts.nlr.gov/downloads/pvwattsv5.pdf (method and default loss assumptions).

Borizo is an independent guide to plug-in and balcony solar in the US. We track state laws, check certification claims against official sources, and compare kits using published specifications. Laws change often, so every state page shows a “last updated” date and links to its sources. We earn a commission when you buy through our Amazon links, at no extra cost to you. Our content is for information only and is not legal or electrical advice.