Plug-In Solar in the Desert Southwest: Sun, Heat and Dust
If you rent or own a home in Arizona, Nevada, southern California or west Texas, you probably have more sunshine than almost anyone in the country, and also more heat and dust than most plug-in solar guides assume. This post answers a simple question: what changes for a plug-in solar kit in the desert Southwest? We use NREL’s PVWatts model with Phoenix, Arizona as the example city, state every input, and compare it with other regions. We also cover heat, railing angle and dust using NREL’s PVWatts manual and FEMA’s Ready.gov heat guidance. We do not explain state rules here; those are on our state laws page. It is general information, not legal or electrical advice, and we have not tested any product.
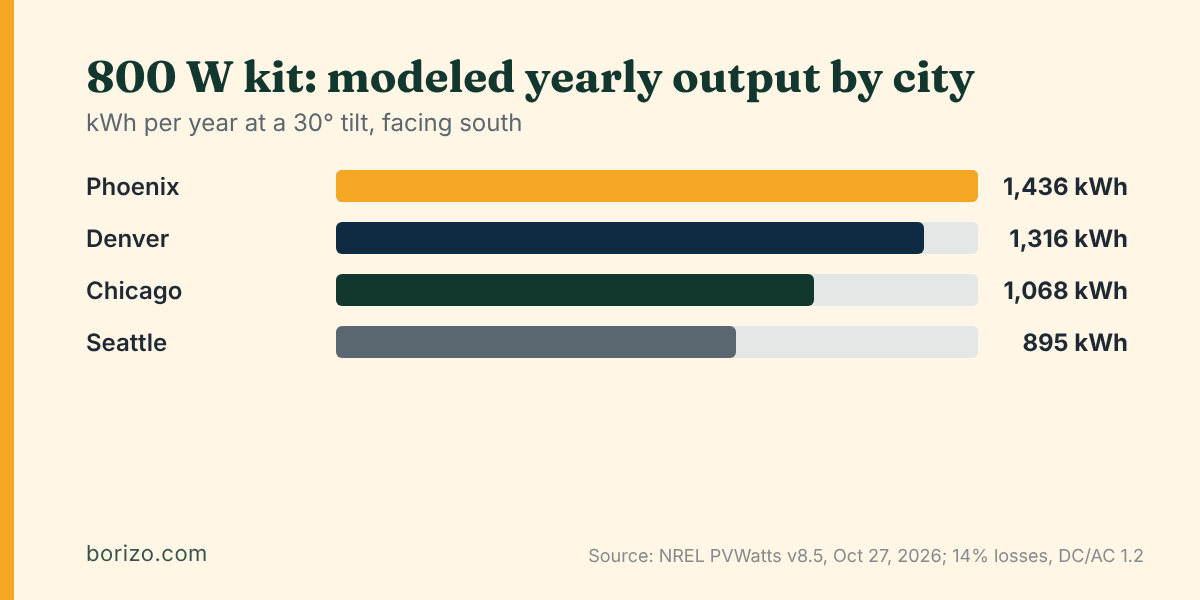
The desert Southwest is one of the best US regions for plug-in solar on sun alone. Our PVWatts run for Phoenix models about 1,436 kWh a year for an 800 W kit, versus 895 kWh in Seattle with the same settings. Heat trims output slightly and dust needs a cleaning habit, but neither cancels the sun advantage.
- Sun is the advantage. Phoenix averages 6.58 kWh/m² a day on a 30° panel in our run, against 3.98 in Seattle.
- Output is steady. The weakest winter month still models about three-quarters of the best month.
- Heat is a modest drag. NREL’s default temperature coefficients are -0.20% to -0.47% per °C depending on panel type.
- Angle still matters. A vertical railing panel models about 60% of the angled result in Phoenix.
- Plan for dust. PVWatts allows 2% for soiling inside its 14% default losses; real sites vary.
Why the desert Southwest is different for plug-in solar
Most plug-in solar advice is written for a mixed climate. In the desert Southwest the sun is stronger, the sky is clearer for more of the year, and summer is long and hot. Those three facts change what matters: sun hours are an advantage, heat is a modest drag, and dust is something to plan for. To keep the numbers honest we use Phoenix, Arizona as the example city, because it is a large desert-climate city with a published NREL weather file. Tucson, Las Vegas and El Paso will differ, so treat Phoenix as a reference point and run your own address.
The key input is how much sunlight lands on the panel. NREL’s PVWatts reports it as “solrad” in kilowatt-hours per square meter per day (see the PVWatts V8 API documentation). For a 30° south-facing panel, our Phoenix run shows 6.58 kWh/m² a day on average. Seattle, run with identical settings, shows 3.98. That gap of roughly two-thirds more sunlight is the main reason Phoenix output is so high. The same idea is covered nationwide in plug-in solar sun hours by region.
What PVWatts models for a Phoenix kit
We ran an 800 W kit (a common example size on this site) in PVWatts for Phoenix. The model returns 1,436 kWh of AC output over a typical year. At the 2025 average US residential price of 17.30 cents per kWh (EIA Electric Power Monthly), that is about $248 a year if every kilowatt-hour displaces grid power you would otherwise buy. Your local price will differ, so use your bill; the savings and payback calculator lets you enter it.
| Month | Modeled AC output, kWh (0.8 kW kit) | Sun on the panel, kWh/m² per day |
|---|---|---|
| Jan | 105 | 5.37 |
| Feb | 105 | 5.96 |
| Mar | 127 | 6.79 |
| Apr | 136 | 7.57 |
| May | 138 | 7.57 |
| Jun | 130 | 7.59 |
| Jul | 119 | 6.80 |
| Aug | 121 | 6.85 |
| Sep | 121 | 6.95 |
| Oct | 120 | 6.42 |
| Nov | 109 | 5.84 |
| Dec | 105 | 5.29 |
| Year | 1,436 | 6.58 (avg/day) |
Look at the shape of the year. The best month is May (138 kWh) and the weakest are December, January and February (105, 105 and 105 kWh). The weakest month still produces about 76% of the best one. In Seattle the same comparison is closer to 26%. Summer (June to August) delivers 370 kWh and winter (December to February) delivers 315 kWh, so a desert kit earns steadily all year instead of living off a few summer months.
One detail: output does not peak in the hottest months. June to August are below May in the table even though the sun is just as high. That is the effect of heat, covered below.
Railing panels versus angled panels in the desert
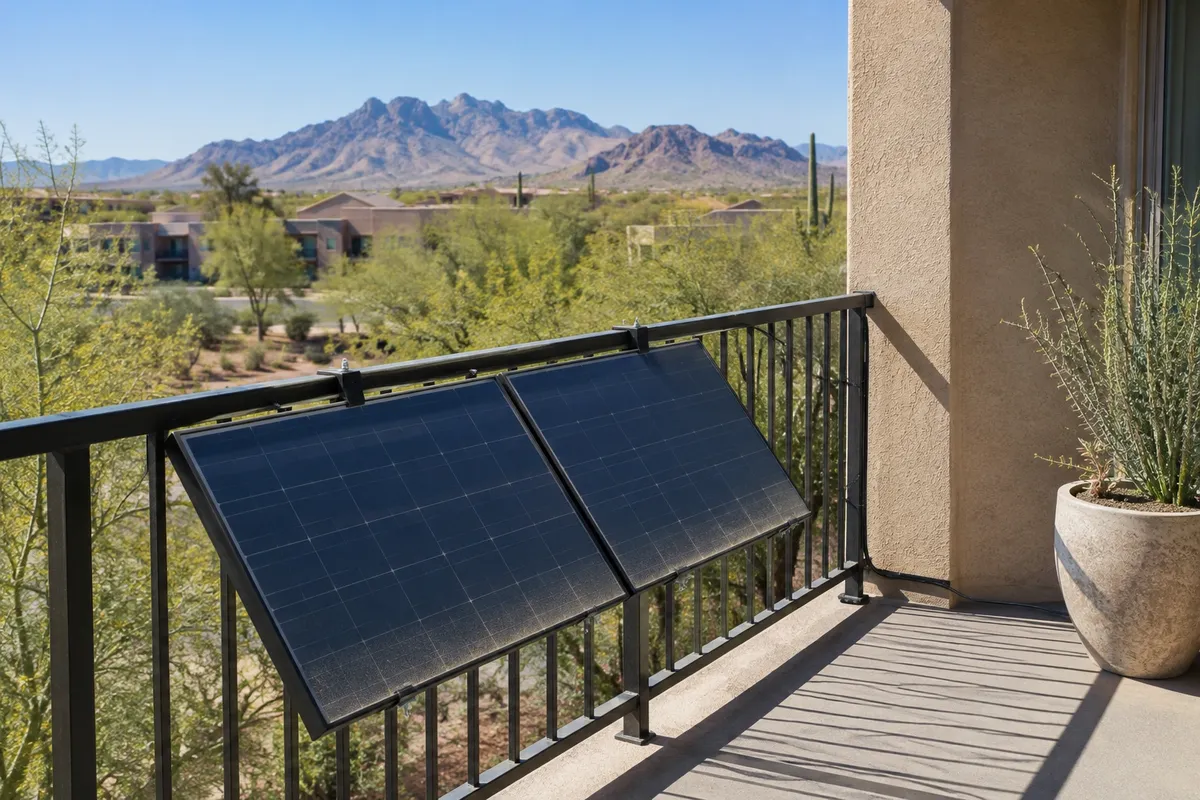
Many balcony kits hang vertically on a railing instead of sitting at a 30° tilt. With the same settings but a 90° tilt, PVWatts gives Phoenix 858 kWh a year, about 60% of the angled result. A vertical panel gives up output because the high summer sun shines almost over the top of it; the penalty is larger in a southern location than in the north. If your railing allows a tilt-out bracket, even a modest angle helps; see the best angle for a balcony solar panel. If it does not, the vertical number is the more honest planning figure.
Direction matters too. A balcony that faces west will make more of its power in the afternoon, which is also when many desert homes run air conditioning. Our guide to running an air conditioner with plug-in solar explains how to compare a kit’s output with an AC unit’s draw before expecting the two to match.
Heat: what the manual says and what you can control
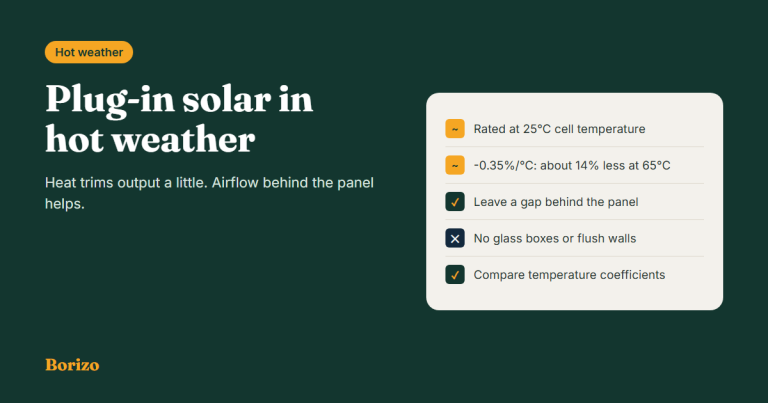
Solar panels lose a little output as they get hotter. NREL’s PVWatts Version 5 Manual lists default temperature coefficients of -0.47% per °C for standard modules, -0.35% for premium modules and -0.20% for thin-film modules, measured against a 25°C reference cell temperature. The manual also assumes a cell runs hotter when mounted close to a roof: it uses a nominal operating temperature of about 49°C for a roof mount with 4-inch standoffs, versus 45°C for an open rack. The practical lesson is air flow. A panel with open space behind it runs cooler than one pressed flat against a hot wall.
That is a modeled effect, not a promise about your kit. Look up the temperature coefficient on your panel’s spec sheet, and read plug-in solar in hot weather for the full explanation. The modeled Phoenix year above already includes this heat effect, which is why summer sits below spring.
Heat also affects people. FEMA’s Ready.gov extreme heat page (read October 27, 2026) says not to rely on a fan as your primary cooling device and to go to a cooling center if you do not have air conditioning. A plug-in kit trims your bill; it is not a cooling plan.
Dust, soiling and cleaning
Dust on glass blocks some light. PVWatts bundles soiling into its system-loss input, and the default breakdown in the manual allows 2% for soiling inside a 14% total (shading 3%, wiring 2%, and so on). We used the 14% total in the table. In a dusty desert location your real soiling loss could be higher or lower than that default, and the model cannot tell you which. If you notice output drifting down in the app, a dirty panel is one of several explanations; tracking the monthly total in the app helps you spot the trend.
When you clean, follow the manual: most manufacturers recommend soft water and a soft cloth rather than abrasives. Clean when the panel is cool and only from a safe position; never lean over a railing to reach it.
Checklist for a desert Southwest balcony
- Check the rules first. Plug-in solar is regulated state by state; see our state laws page, then ask your landlord or HOA.
- Look up your own address in PVWatts. Enter the real tilt and direction instead of relying on the city example.
- Plan for air flow. Leave space behind the panel so it can shed heat, as your manual allows.
- Read the temperature range in the inverter manual. Keep the inverter and cables in the shade or placement the manual allows.
- Set a cleaning habit. Note the monthly output in the app so a dirty panel shows up as a trend.
- Check your kit’s output limit and ratings. Confirm the inverter output rating against any limit that applies to you.
Frequently asked questions
Is Arizona good for plug-in solar?
On sunshine, yes. Our PVWatts run for Phoenix models about 1,436 kWh a year for an 800 W kit at a 30° tilt, the highest of the 11 cities we modeled. Whether you may use plug-in solar depends on state and building rules, so check our state laws page and your lease or HOA first.
Does extreme heat ruin solar panels?
Heat lowers output slightly but is a normal operating condition. NREL’s PVWatts manual lists temperature coefficients of -0.20% to -0.47% per °C, depending on panel type. Check your panel’s spec sheet, keep air flow behind it, and follow the manual’s temperature range for the inverter.
Should I tilt or hang my panel vertically in the desert?
Tilted panels produce more over a year. Our Phoenix run gives 1,436 kWh at 30° and 858 kWh at 90°, about 60% as much. A vertical railing mount is still fine if that is what your balcony allows; just plan around the lower figure.
How often should I clean panels in a dusty area?
There is no single schedule. PVWatts assumes 2% soiling inside its 14% default losses, and real dust varies by site. Watch your output trend in the app, clean when it falls, and use only the cleaning method the manual recommends.
Sources
- NREL, PVWatts Calculator, API v8.5.0, runs made October 27, 2026 (Phoenix and comparison-city runs at 30° and 90° tilt; inputs under the table).
- NREL, PVWatts Version 5 Manual (NREL/TP-6A20-62641), September 2014, read October 27, 2026 (temperature coefficients; roof-mount versus open-rack operating temperature; default loss table with 2% soiling and 14% total).
- NREL, PVWatts V8 API documentation, read October 27, 2026 (solrad reported in kWh/m²/day; default DC-to-AC ratio and inverter efficiency).
- EIA, Electric Power Monthly, read October 27, 2026 (2025 average US residential price, 17.30 cents/kWh).
- FEMA, Ready.gov: Extreme Heat, read October 27, 2026 (do not rely on a fan as the primary cooling device; cooling centers).

Borizo is an independent guide to plug-in and balcony solar in the US. We track state laws, check certification claims against official sources, and compare kits using published specifications. Laws change often, so every state page shows a “last updated” date and links to its sources. We earn a commission when you buy through our Amazon links, at no extra cost to you. Our content is for information only and is not legal or electrical advice.